KNOW WHY
Create true process intelligence
Master every facet of your processes

UNDERSTAND
See everything in context

UNDERSTAND
See everything in context
DEFINE
No uncertain steps. No uncertain outcomes.


VISUALIZE
See how everything connects
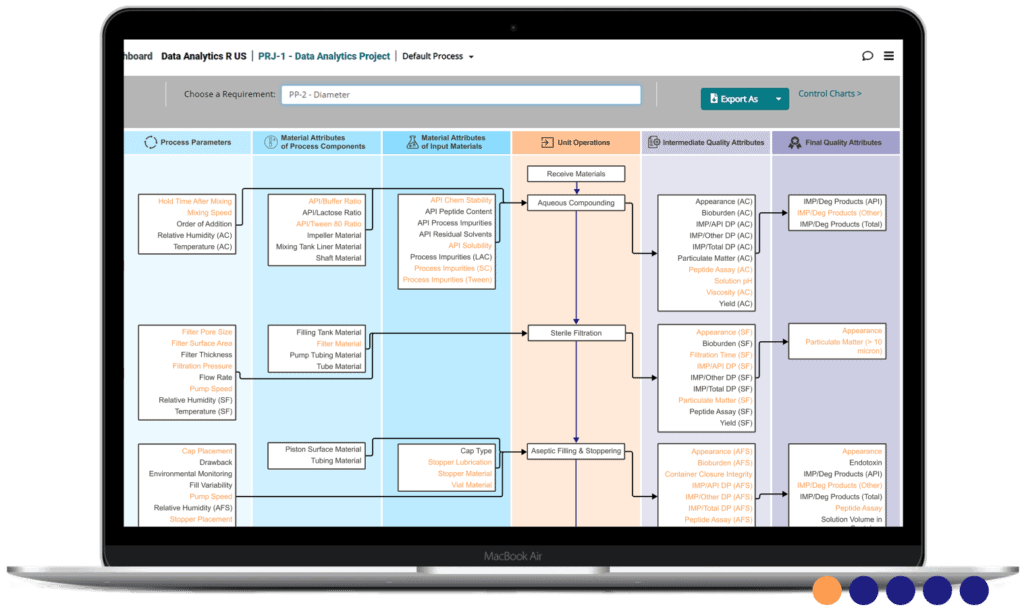
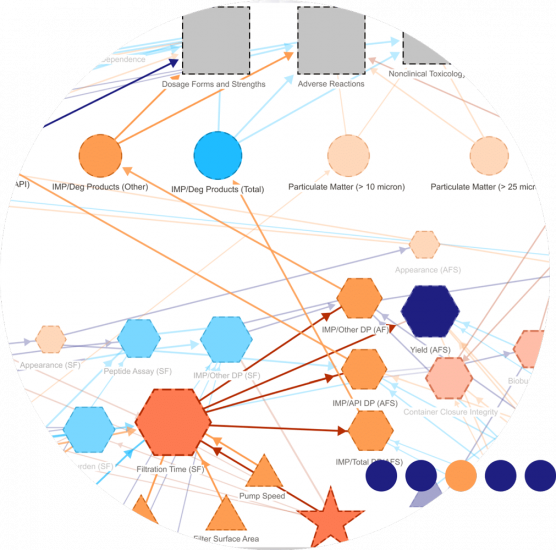
QbDVision enables novel, data-enriched visualizations of potential impact chains in your development strategies. Your teams can instantly see the relationships between input and output variables, and visually investigate the impact of any changes, variances, and non-conformances.

IDENTIFY
Map out cause-and-effect relationships
Get an unrivalled level of insight into how any action, input, or shift can cascade through your development workflows. QbDVision’s unique visualizations help you explore the impact of process changes, rapidly pinpoint potential downstream risks, and identify upstream variables that may affect current performance.

CONTROL
Develop strategies to manage residual risk
With QbDVision’s holistic view of your processes, you can design, implement, and track both risk mitigation and residual risk control strategies as part of your overall control strategy. Get both the clear historical context and forward-looking insights you need to predict, manage, and proactively control potential risks.

FEATURED SOLUTION
Risk-based traceability
Visual maps show your teams a multidimensional view of their critical inputs, and enable them to graphically model cause/effect relationships with outputs. See all the implicit connections between your product attributes, process parameters, risk factors, and more.
- Generate novel, visualized risk maps
- Eliminate spreadsheets, fishbones, and flowcharts
- Automate compliance in criticality evaluations
GO DEEPER
See everything our platform makes possible
OUR PLATFORM
Modern software for pharma and biotech
See how QbDVision digitizes management of the whole product life cycle.
KNOW WHERE
Centralized knowledge management
Collect your team’s data and knowledge in one searchable cloud-based hub.
KNOW HOW
Streamlined process development
Create robust, agile processes that your teams can control as one.
Start creating process intelligence today
See how quickly QbDVision can deliver the guidance you need to accelerate the development cycle.


